papers

A global picture of typhoid bacteria

New paper out: (a bit delayed due to travelling the world for science…)

Phylogeographical analysis of the dominant multidrug-resistant H58 clade of Salmonella Typhi identifies inter- and intracontinental transmission events

Nature Genetics 2015 Jun;47(6):632-9. doi: 10.1038/ng.3281

This paper provides a whole-genome snapshot of nearly 2000 genomes of the typhoid bacterium, Salmonella Typhi. The strains involved come from 63 countries contributed by dozens of people around the world, and were sequenced at the Sanger Institute with funding from the Wellcome Trust.

You can get the raw sequence reads under accession ERP001718, and play with the phylogenetic tree and associated map at the new MicroReact website:

Countries included in the study

Countries included in the study

I will post more later about plotting trees & metadata dynamically with MicroReact, and statically with Python and R.

But back to typhoid. This project is special for me for a number of reasons…

  • It is about Typhi, the bug that suckered me into directing my genomics skills into studying pathogens and infectious disease, and was the subject of my PhD project with Gordon Dougan and Julian Parkhill at the Sanger Institute, and Duncan Maskell at Cambridge.
  • It is a natural continuation of my PhD project, with the grunt work done by the new PhD student who took over typhoid genomics work in the Dougan lab when I moved back to Australia (Vanessa Wong, MD PhD), with me helping to direct the analysis from down here in Melbourne.
  • It is a great illustration of how sequencing has changed… The first Typhi genome sequence was done at the Sanger Institute using capillary sequencing, and was published in 2001 (Parkhill et al, Nature). In my PhD project (also at the Sanger Institute), I analysed 19 Typhi genomes sequenced with two sequencing platforms that were new and super-duper back in 2006: 454 (now dead) and Solexa (now known as Illumina – currently ruling the sequencing world globally). This was published in 2008, seven years after the first genome (Holt et al, Nature Genetics). Now, another 7 years later in 2015, we are publishing almost 2000 genomes.
  • Typhi is still one of the best examples I know of how sequencing has transformed bacterial surveillance and opened up a whole new field of genomic epidemiology. Before we could look at whole genomes, every Typhi strain looked pretty much the same genetically… there is so little variation, that lower resolution approaches like MLST just couldn’t tell us anything. Now that we can capture whole genomes relatively easily, we can track the transmission and evolution of these bugs essentially in real time.

So what did all this sequencing achieve? Basically we learnt a lot about a particularly tricky clone, called H58, that has spread quite rapidly across Asia and Africa and is responsible for most cases of multidrug resistant typhoid (infections that don’t respond to treatment with most antibiotics). About half of all our isolates belonged to this clone.

  • By comparing root-to-tip branch lengths in the phylogenetic tree of H58 to the isolation dates of each strain, we found evidence of a temporal signal. So we did BEAST analysis, using the isolation date of each strain to date the tips and model mutation rates and divergence dates for H58. This showed that SNPs accumulated slowly in the Typhi H58 genome, at a rate of ~2 SNPs every 3 years. This placed the emergence of H58 at ~1989, just before our oldest example of H58 (1992). We haven’t been able to do proper dating in Typhi before, probably because most of the samples we’ve looked at previously have been phylogenetically diverse strains that are separated by centuries of evolution including periods of epidemic transmission (higher mutation rate per unit time) and long-term carriage (lower mutation rate per unit time). Here we probably have enough data from a period of epidemic transmission of H58 that the signal from epidemic transmission is detectable. I think this is very similar to Mycobacterium tuberculosis (TB), which notoriously has very little temporal signal, and yet a localised 4-decade transmission chain in Argentina showed very strong temporal signal.pathogen_linear_regression_fullANDh58
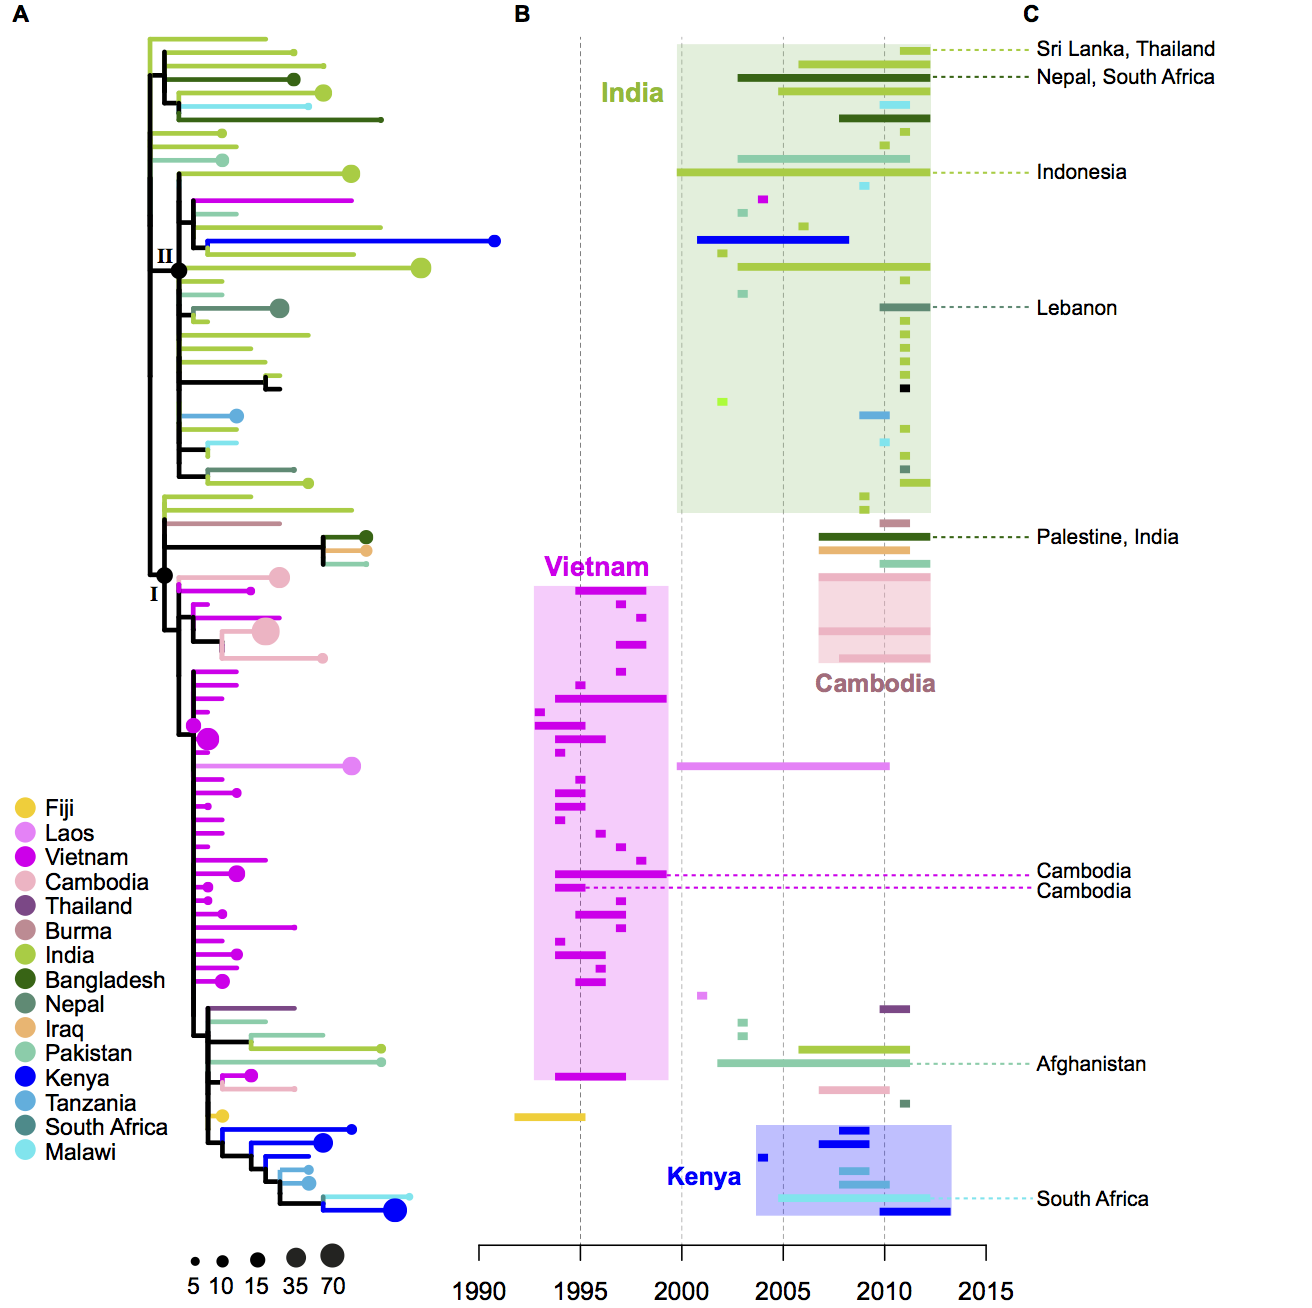
  • The geographical distribution of the H58 isolates tell us a lot about the routes by which H58 has travelled the world. The tree of H58 is so big that it’s hard to see what’s happening…. so to make it easier, I used R to collapse localised subclades of H58 that contained isolates from a single country (panel A – the size of the circle reflects the number of isolates in the subclade), and showed the time span for each subclade next to the tree (panel B). Occasionally there were one or two isolates within a localised subclade that were sourced from neighbouring countries, indicating transfer to those countries… these are shown in panel C.

collapsed_tree_timelines2

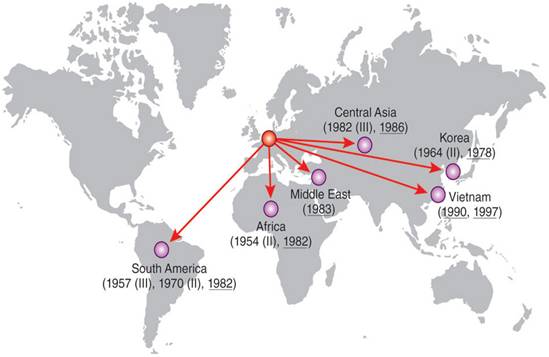
  • We inferred these geographical patterns of the spread of H58, based on the tree and the regions of isolation:

map

  • We learnt a lot about the evolution of multidrug resistance in Typhi H58. We knew that resistance to all first-line antibiotics was usually encoded in one big transposon, which came into H58 in a IncHI1 plasmid. But the new collection showed that this transposon has transferred into the Typhi H58 chromosome, not once but many times! These transfers have happened in separate events, in different parts of the world, and into different parts of the chromosome. This is what the transposon looks like, and two of the insertion sites relative to the reference chromosome (CT18):

Acquired multidrug resistance in Typhi H58

  • Finding transposon insertion sites is tricky! The transposon has copies of the IS1 transposase at either end, which we think are responsible for moving the whole transposon around. This poses a problem for genome assembly with short reads. One way around this is to sequence with long reads… the figure above shows two different insertion sites that we confirmed by using PacBio sequencing to get complete genomes. But we had >850 H58 genomes sequenced using Illumina which gives us short reads, so really we needed to figure out the insertion sites as best we could using the Illumina data. Luckily my PhD student Jane Hawkey had been working on a method to do this, called ISMapper. Using this approach, we could identify all the IS1 insertion sites in every Illumina-sequenced genome. We also found a couple of additional plasmids. This is where all the different multidrug resistance determinants are in the H58 population:

MDR_summary_regionAsRing

Finally, a clear message from this study is that we need to do a lot more sequencing of Typhi! While we have a lot of genomes here, there are large geographic areas that we just don’t know much about. Plus, we have seen that antibiotic resistance is evolving and changing fast, and we will need to keep up with this using ongoing genomic surveillance.

Bacterial colonization of the airways during the first year of life

The latest paper from the group is out in Cell Host & Microbe:

The Infant Nasopharyngeal Microbiome Impacts Severity of Lower Respiratory Infection and Risk of Asthma Development
Shu Mei Teo, Danny Mok, Kym Pham, Merci Kusel, Michael Serralha, Niamh Troy, Barbara J. Holt, Belinda J. Hales, Michael L. Walker, Elysia Hollams, Yury A. Bochkov, Kristine Grindle, Sebastian L. Johnston, James E. Gern, Peter D. Sly, Patrick G. Holt, Kathryn E. Holt*, Michael Inouye*

http://www.cell.com/cell-host-microbe/abstract/S1931-3128(15)00125-0

Also see preprint in BioRxiv

Graphical abstract

Basically, what we did is to perform 16S rRNA sequencing (V4 region, via MiSeq) on post-nasal aspirates (basically snot washed out of babies’ noses) collected from children as part of a cohort study called the Childhood Asthma Study run by the Telethon Kids institute in Perth, Western Australia.

Samples were collected at around 2 months, 6 months and 12 months of age, during periods of respiratory health (i.e. no symptoms of respiratory illnesss for at least 1 month). Also, every time a baby developed symptoms of respiratory illness, a study nurse would come and examine the child and take another sample. The snots were divided into 4 aliquots each and cryofrozen until last year, when one aliquot each was thawed for DNA extraction.

The 16S data showed very simple communities of bacteria in each sample… basically each sample was dominated by a single genus, either Staphylococcus, Corynebacterium, Alloiococcus, Moraxella, Streptococcus, or Haemophilus. Temporal colonization patterns indicated that most children were initially colonized with skin-associated organisms (Staphylococcus or Corynebacterium), which was replaced during the first year of life by stable colonization with Alloiococcus or Moraxella.

strep_haem_morax

Amongst the samples taken during episodes of respiratory illness, we found that Moraxella, Streptococcus, or Haemophilus were very common. We also found the presence of these bacterial genera was associated with increased severity of symptoms of respiratory illness – samples with these bacteria were more likely to be from infections that spread to the lower respiratory tract (i.e. where the child had wheeze or rattly chest) and experienced fever (signalling an inflammatory response).

Importantly, we found that the children who experienced lower respiratory illness with fever were more likely to be chronic wheezers (i.e. asthmatic) at the age of 5 or 10 years, especially if they became sensitised to aeroallergens during their second year of life.

This suggests that Moraxella, Streptococcus, or Haemophilus colonization in infancy may be risk factors for severe respiratory illness and later asthma development. This could potentially explain earlier studies showing that colonization with M. catarrhalis, S. pneumoniae or H. influenzae (detected by culture) at the age of 1 month is associated with increased risk of asthma in childhood.

Many more details are available in the paper! http://www.cell.com/cell-host-microbe/abstract/S1931-3128(15)00125-0

Global and local views of Shigella sonnei population genomics

If you have seen me give a talk in the last couple of years, chances are you would have heard a bit about Shigella sonnei. This is because it has been my favourite project in recent years, for two main reasons:

(1) it involved looking in-depth at phylogeography and evolution of the same organism at two different scales – first globally, over hundreds of years and then locally in Vietnam, over about 15 years; and

(2) it was done with two people I really enjoy working with – Steve Baker (based at the Oxford University Clinical Research Unit in Vietnam) and Nick Thomson (based at the Sanger Institute).


Here are the papers:

Shigella sonnei genome sequencing and phylogenetic analysis indicate recent global dissemination from Europe

Holt KE, et al. Nature Genetics 2012 [PubMed]

This study used whole genome sequencing of a global collection of 132 Shigella sonnei, an increasingly important cause of dysentery, to reconstruct the evolutionary history of the bacterium. Phylogenetic analysis showed that the current S. sonnei population descends from a common ancestor that existed less than 500 years ago and that diversified into several distinct lineages with unique characteristics. Furthermore the analysis suggests that the majority of this diversification occurred in Europe and was followed by more recent establishment of local pathogen populations on other continents, predominantly due to the pandemic spread of a single, rapidly evolving, multidrug-resistant lineage.

Commentaries on the paper are available in Nature Genetics and Nature Reviews Gastroenterology and Hepatology.

Dissemination of S. sonnei lineages out of Europe. Reprinted by permission from Macmillan Publishers Ltd: Nature Genetics 44:1056, copyright 2012.

Dissemination of S. sonnei lineages out of Europe. Reprinted by permission from Macmillan Publishers Ltd: Nature Genetics 44:1056, copyright 2012.

Tracking the establishment of local endemic populations of an emergent enteric pathogen

Holt KE, et al. PNAS 2013 [PubMed]

This study continues the Shigella sonnei story by examining the arrival of the rapidly evolving multidrug-resistant lineage in one particular country – Vietnam. We sequenced over 250 genomes of S. sonneiisolated over a 15-year period, and found that the multidrug-resistant lineage successfully established itself in Ho Chi Minh City, pushing out other dysentery-causing bacteria to become the dominant cause of dysentery.

This was likely helped by the acquisition of a colicin (toxin) system that enabled it to kill competing bacteria it came into contact with (including otherShigella), forming a new clone we called the VN (Viet Nam) clone. The VN clone spread to other cities in Vietnam, and we found evidence of convergent evolution of drug resistance mutations and plasmids in all three local populations we examined.

Phylogeny of Vietnamese S. sonnei and map of Vietnam, showing the inferred path of evolution and geographical spread.

Phylogeny of Vietnamese S. sonnei and map of Vietnam, showing the inferred path of evolution and geographical spread.

Typhoid in Kathmandu and Open Biology OA journal

A paper I’ve been working on for a few years on typhoid in Kathmandu yesterday had the honour of being the first paper ever published by the new open access journal of the Royal Society, Open Biology. I’m very keen on open access publishing and always try to submit to OA journals, but there is still a limited choice of truly OA journals. I love PLoS and BMC and submit to both regularly, but I think it’s really important to have a diverse range of OA journals – and therefore diversity in editors, editorial policies & styles, subject areas, etc – to make open access work for everyone.

So I’m excited to be have a paper in the new Open Biology, who publish under a Creative Commons 3 license (reuse/modify/distribute with attribution). Only time will tell how well the journal does, but it will only become great if us scientists are willing to submit good manuscripts. One incentive to do this is that Open Biology aims for a quick turn-around time of 4 weeks from submission to decision. Much as I love PLoS and BMC, they’ve never managed anywhere near that sort of turn-around. For info on Open Biology, see their ‘About’ page https://royalsocietypublishing.org/rsob/about.

So what is the paper? Thanks to OA, I can reproduce it here… (or you can read online or PDF)

Combined high-resolution genotyping and geospatial analysis reveals modes of endemic urban typhoid fever transmission

Stephen Baker1,2,*,†, Kathryn E. Holt3,4,†, Archie C. A. Clements5, Abhilasha Karkey2, Amit Arjyal2, Maciej F. Boni1,6, Sabina Dongol2, Naomi Hammond4, Samir Koirala2, Pham Thanh Duy1, Tran Vu Thieu Nga1, James I. Campbell1, Christiane Dolecek1,2, Buddha Basnyat2, Gordon Dougan4 and Jeremy J. Farrar1,2

Open Biol October 2011 1:110008; doi:10.1098/rsob.110008.

Basically, it uses genotyping and GPS to study typhoid fever in Kathmandu, Nepal. We examined 4-years worth of typhoid cases and looked at where the patients lived within the city (using GPS) and subtyped the bacteria responsible for their infections using high throughput SNP typing.

Firstly, we found that about 3/4 of the patients were infected with Salmonella Typhi and 1/4 were infected with Salmonella Paratyphi A. If you aren’t familiar with Salmonella, these are two serotypes of Salmonella enterica which, rather than causing gastrointestinal disease (ie food poisoning) like most Salmonella serotypes, cause the systemic infection known as typhoid. Typhi and Paratyphi A are quite different genetically, but have undergone convergent evolution to cause the same disease syndrome (see earlier paper in BMC Genomics).

Temporal distribution of Typhi (red) and Paratyphi A (blue) cases

Then we looked at the spatial distribution of the patients homes, and found that they were clustered in specific “hotspot” areas of Kathmandu:

Spatial risk model for Typhi infection (see paper for separate map for Paratyphi A risk)

Contrary to expectation, these hotspots weren’t the most densely populated areas…you might expect more people = more cases, but this wasn’t the case. Some complicated spatial statistics, done by Archie Clements at University of Queensland, confirmed that the hostpots weren’t associated with population density or hospital referral patterns, but were in low-elevation areas local people source their water from stone waterspouts.

Spatial distribution of Typhi cases, and location of water spouts

To see if the waterspouts could really be a source of typhoid transmission, we tested water samples for the presence of Typhi or Paratyphi A using culture and PCR. Culturing didn’t work, but it is notoriously difficult to culture Typhi from water samples that are not pre-enriched for bacteria…however PCR (using this method we published earlier in BMC Infectious Diseases) detected Typhi in 3/4 of water samples and Paratyphi A in 2/3.

Stone water spouts in Kathmandu (taken by co-author Stephen Baker)

We also looked at the population of bacteria causing the typhoid fever. We examined Salmonella Typhi isolated from the blood of typhoid fever patients, and used SNP typing to analyse the Typhi DNA and examine the population structure. We typed 113 SNPs (single nucleotide polymorphisms, ie point mutations) that we already knew about from previous variation discovery efforts. About 2/3 of isolates had the same haplotype, so to discriminate further within this local subgroup we sequenced 40 of the Typhi to identify novel SNPs arising in the local population (local microevolution) and typed these SNPs as well. Most of the Typhi belonged to the H58 lineage, which is common in other typhoid endemic zones we’ve looked at previously (Mekong Delta Vietnam – Holt & Dolecek 2011, PLoS NTD [OA]; Nairobi, Kenya – Kariuki 2010, J Clin Micro [free]; globally – Holt & Phan 2011, PLoS NTD [OA], Roumagnac 2006, Science [free in PMC]).

Typhi tree, red bars indicate frequency of genotypes in Kathmandu collection; red zones are H58 lineage and H58G sublineage

As the map above shows, the different Typhi genotypes were distributed randomly, with no spatial or temporal clustering. The exception was a probable outbreak in the west of the city, outside the hotspot zone, where 28 cases of infection with the same Typhi genotype were recorded in a two-month period – see yellow shaded area in map above, and zoomed in below:

Localised outbreak of Typhi genotype H58G-b4

Finally, we looked at what was happening in households from which multiple typhoid infections were studied. You might expect these household disease clusters to represent shared infections, which are transmitted between members of the household. However in most of these household typhoid clusters, the cases were caused by different organisms – either Paratyphi in one case and Typhi in the other, or multiple cases caused by different genotypes of Typhi. Cases with the same causative Typhi genotype are linked with dashed lines in this figure, you can see they are the exception rather than the rule:

Distribution of typhoid-causing bacteria in households with multiple typhoid cases

So, all in all we found typhoid fever infections clustered in spatial hotspots within Kathmandu, and that this clustering was explained not by population density but by low elevation and proximity to stone water spouts which are used to supply water. This implicates the water spouts in typhoid transmission via dissemination of Typhi and Paratyphi A around the city, supported by the detection of Typhi and Paratyphi A in the majority of water samples taken from these spouts. The diversity of Typhi genotypes we detected indicates that transmission occurs via water that is contaminated with a diverse population of Typhi, rather than point source outbreaks (with the exception of one outbreak, which actually occurred outside the hotspot zone). The diversity of Typhi genotypes within households suggests that this sort of transmission – ie dissemination via contamination of the water supply – contributes more to the overall typhoid burden than direct person-to-person transmission.

How does this contamination happen? Well, it is possible for people to carry Typhi and Paratyphi A in the gall bladder, without ever noticing an infection…for example, Typhoid Mary was a famous carrier of Typhi. Carriers shed the bacteria in their feces, so any food or water contaminated with their fecal material becomes a vehicle for typhoid transmission. Our study suggests that there are many Typhi and Paratyphi A carriers in Kathmandu who are unknowingly shedding the bacteria, so that whenever sewage seeps into the groundwater that feeds the stone water spout, the water becomes contaminated and can pass on the infection to those who drink the water. Most of the typhoid cases occur in the monsoon season, when flooding is likely to promote seepage of sewage into the underground aquifers that supply the water spouts. Hence the study suggests that endemic typhoid in Kathmandu is essentially a question of water infrastructure, and could potentially be dramatically reduced by supplying clean drinking water to people living in these few hotspot areas.