antibiotic resistance

AMR distribution in intestinal E. coli from children in Asia and Africa


Today I’m pleased to see the final version of our paper on antimicrobial resistance in intestinal E. coli from Asian & African children published in Nature Microbiology. This is last piece of the puzzle from Danielle Ingle’s PhD research, a tremendous effort centred around the analysis of a collection of ~200 atypical enteropathogenic E. coli (aEPEC) isolated from cases and controls in seven countries during the Global Enterics Multicentre Study (GEMS).

The first analysis of the genome data from this collection was reported in this 2016 paper, also in Nature Microbiology. It focused on understanding the population structure of the pathotype, including establishing a framework for looking at variation in the primary virulence locus (the LEE pathogenicity island; see blog post here).

aEPEC_distribution

Danielle then looked at serotype diversity in the collection, and used the experience to tackle the problem of O and H serotype prediction from genome data. That work is detailed in this Microbial Genomics paper, which utilises the phenotypes and genome data from the GEMS aEPEC collection to assess the reliability of predictions.

Finally we turned our attention to antimicrobial resistance (AMR) in the isolate collection – characterising resistance phenotypes, looking at known genetic determinants of AMR in the genome data, and also examining data on prescribing of antimicrobials for treatment of diarrhoeal disease in children at each study site.

So what did we find?

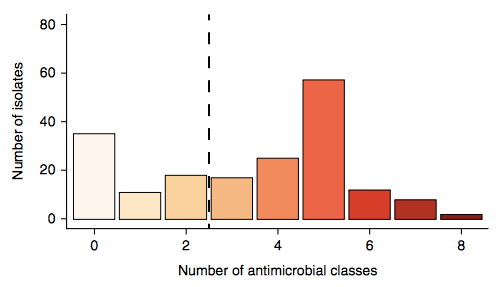
Firstly, whether we consider AMR phenotypes or genotypes we see that AMR was rampant, with most strains either multidrug resistant (65%; resistan to ≥ 3 drug classes) or susceptible to all drugs tested (19%):

AMR_classes

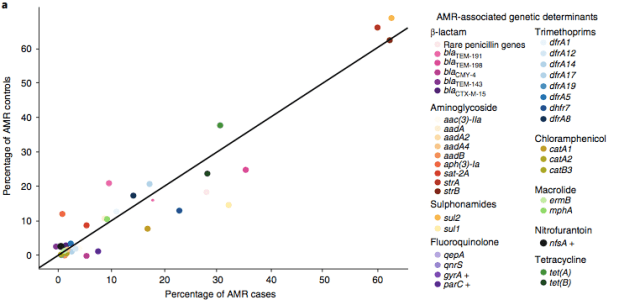
We found >40 different acquired AMR genes in the genomes, and also point mutations that are known to be associated with resistance to fluoroquinolones (in gyrA, parC) or nitrofurantoin (nfsA). Notably there was no difference between AMR rates in cases and controls, even at the level of individual genes:

genewise case control

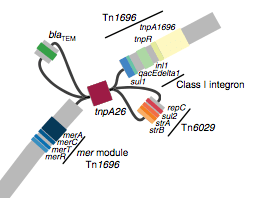
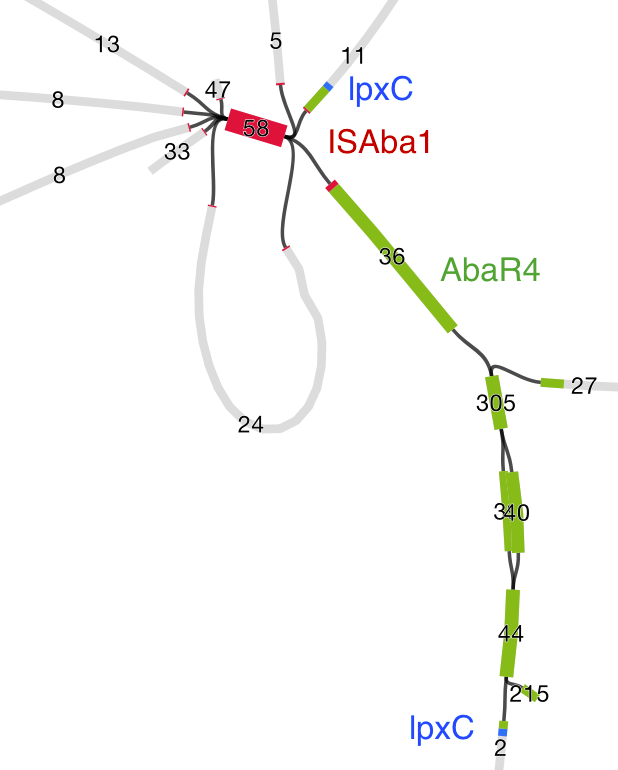
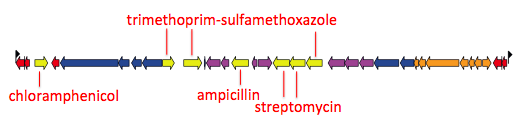
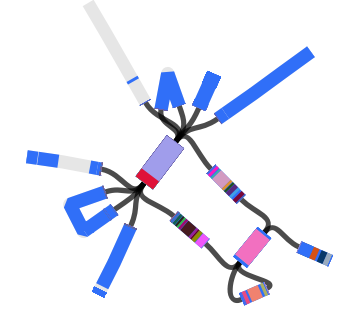
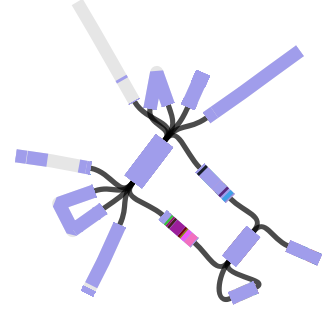
We found that many of these AMR genes co-occured together in known mobile genetic elements:

Screen Shot 2018-08-21 at 12.59.41 pm.png

Quite often the structures of these elements were not totally resolvable from the genome assemblies, which were based on short Illumina reads only (no long reads for this data set unfortunately!)… but nevertheless, Danielle could often resolve co-localisation of these genes from the assembly graphs using Bandage:

Screen Shot 2018-08-21 at 1.00.28 pm

We had seen in the first paper that the isolates were highly diverse, comprising dozens of distinct clones… this tree is inferred from a core gene alignment of the study isolates together with some other genomes for context (GEMS study isolates are indicated as dark blue in the outer ring). The ten shaded clades indicate dominant clonal groups in the study population.

aEPEC_tree

Back to the AMR study. We did a discriminant analysis of principle components (DAPC) to see whether the variation in the distribution of genetic determinants amongst the genomes could be used to discriminate between the clonal groups, and saw that AMR was not associated with individual clones:

clone DAPC

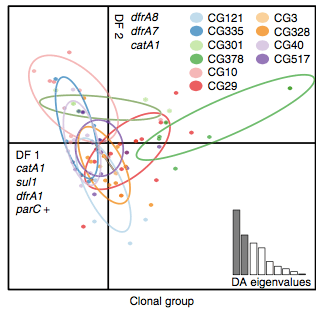
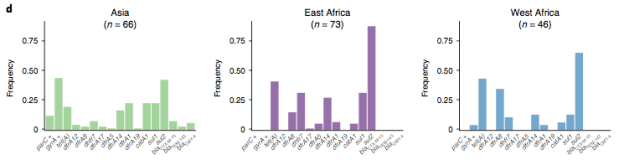
Instead we found that variation in AMR gene complement could discriminate isolates from different geographical region, suggesting that AMR genes more often reflect horizontal acquisition from distinct local gene pools in different parts of the world, rather than fixed features of their host bacterium that travel the world with their host strain (clone):

region DAPC

In particular, we saw that fluoroquinolone resistance associated mutations in gyrA were associated with Asian sites; while sites in East vs West Africa could be discriminated by the presence of different dihydrofolate reductase (dfr) genes responsible for trimethoprim resistance, with dfrA8 being more common in West Africa and dfrA5 being present in East Africa.

region gene prevalence

The data we have showed regional differences in AMR phenotypes, and in antibiotic usage for treatment of paediatric diarrhoea at the GEMS sites.

drug res and usage

a) Resistance phenotypes. b) Frequency of antimicrobials prescribed to children with watery diarrhoea. c) Frequency of antimicrobials prescribed to children with dysentery.

However the prevalence of acquired resistance genes amongst E. coli isolated from each site was not associated with local frequencies of drug usage. The exception was fluoroquinolones: point mutations in gyrA and parC (which reduce MIC to ciprofloxacin) were more common at the Asian sites, where ciprofloxacin was used much more often to treat diarrheal disease than in African sites.

cipR gyrA parC

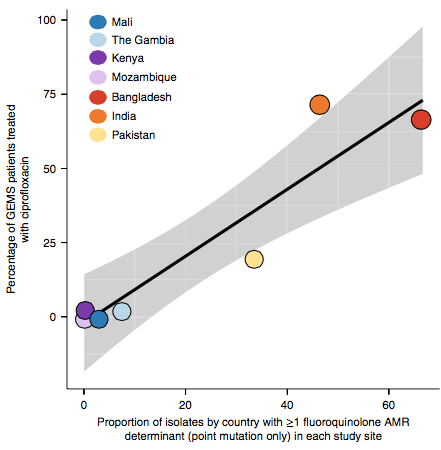
There are many possible reasons for the lack of association between local prescribing for diarrheal disease and the presence of AMR genes in local diarrheal pathogens. We expect that most antimicrobial exposure in human gut bugs like E. coli probably is not associated with attempts to treat E. coli infection at all, but with exposure to drugs given to treat other infections, drugs used in food animals which are a reservoir for E. coli, or even environmental contamination with antibiotics. Also because the horizontally acquired genes tend to travel together as a group in mobile genetic elements, exposure to one drug can co-select for resistance to many. This may be one reason that the association was more evident for ciprofloxacin use and gyrA/parC mutations, which are not in linkage with acquired AMR genes.

Finally, the data provided an opportunity to explore how well we can predict AMR phenotypes based on identifying known genetic determinants of AMR in E. coli genomes. The results were pretty good, indicating low rates of “very major errors” (where we predict a strain to be susceptible, but really it is resistant) for most drug classes. These results are comparable to those done independently in other collections of E. coli and also other bacteria, summarised here. But clearly there is room for improvement, and probably a few new mechanisms floating around out there… notably we didn’t aim to assess changes in expression of intrinsic E. coli genes, such as efflux pumps and beta-lactamases, which can contribute to drug resistance but are not so easy to find in genome data.

geno_pheno


Tracking down insertion sequences causing polymixin resistance in Acinetobacter baumannii

The first plasmid-borne colistin resistance gene was reported late last year. This was big news, but the vast majority of clinically relevant resistance to colistin and related polymixin drugs, which arises frequently in human patients being treated with these drugs, is due to de novo mutations in chromosomal genes. This has been studied quite a lot recently in Acinetobacter baumannii and Klebsiella pneumoniae, where colistin is frequently used to treat patients who are infected with carbapanem resistant strains that are also resistant to pretty much all the other antibiotics as well.

There have been quite a few studies looking for the causative mutations that underly colistin resistance in Acinetobacter and Klebsiella, by comparing the genomes of resistant and susceptible forms of the ‘same strain’ sequenced with high throughput, short read sequencing platforms like Illumina. The typical approach is to catalogue all the differences between strains and look for SNPs and other differences between them. However colistin resistance is usually associated with upregulating pmr activity via point mutations or inactivating the regulator mgrB, or by inactivating the lpx cluster in Acinetobacter. A very common way for gene inactivation to occur is by an insertion sequence (IS) hopping into the open reading frame and disrupting it. IS insertions can also cause resistance by upregulating the expression of intrinsic efflux pump or beta-lactamase genes, for example the ampC gene in A. baumannii. These insertions can be tricky to find using short read data, and are sometimes missed by regular mapping or assembly based approaches.

Luckily we now have two great tools for tracking down such mutations – ISMapper and Bandage – which were critical to tracking down polymixin resistance mutations in a recent study of A. baumannii with colleagues in Singapore. The paper is published in Antimicrobial Agents and Chemotherapy, but unfortunately is paywalled… so quick summary: basically, our clinical researcher friends in Singapore (hello Li Yang!) had 10 pairs of A. baumannii isolates, consisting of a susceptible parent isolate and a derived polymixin isolate (2 that evolved in vivo during treatment with polymixins, and 8 that evolved in vitro during polymixin exposure).

Simply screening for point mutations and deletions identified causative mutations in pmr and/or lpx clusters for 8/10 genomes, but two remained unexplained. A quick screen of the genome assemblies for IS using ISfinder identified several different IS that were present in the 10 A. baumannii genomes. However as these tend to be multi-copy in the genome, they were mostly separated into their own contigs in the assemblies. Enter ISMapper and Bandage, two open source software packages from Jane Hawkey and Ryan Wick in my lab.

First we used ISMapper to identify the locations of all IS sequences in each genome… this involves passing ISMapper each of the different IS sequences, a reference genome to compare to, and the Illumina read sets for the various strains. The isolates were all from global clones 1 or 2 (GC1, GC2), so to get the best results we used a GC1 reference genome for typing IS in the GC1 strains, and a GC2 reference for the GC2 strains. A quick tabulation of the results reveals all the locations of the various IS in each sequence. This identified differential IS insertions in lpx genes (lpxA, lpxC) in three strain pairs, including one in which no other causative mutations had been identified. There was also an IS15 insertion in the mutS gene in one isolate that had many more SNPs and deletions than the others.

ISMapper results

ISMapper results for GC2 strain pairs, showing IS that differed within susceptible-resistant pairs.

ISMapper results for GC1

ISMapper results for GC1 strain pairs, showing IS that differed within susceptible-resistant pairs.

Cool! But what about that one last pair, where ISMapper didn’t find any differences at all between the resistant and susceptible read sets? This time we turned to Bandage, to inspect the genome assemblies and see if we could find a smoking gun. Now we had a clear hypothesis too – we were looking explicitly for interruptions in lpx genesSo we created new assemblies for these read sets using SPAdes. We loaded the graph of the susceptible isolate in Bandage first, and used the inbuilt BLAST search to locate the lpx genes within the graph – all were intact as expected, sitting happily in the middle of long contigs.

Bandage screenshot

Contig containing the lpxC gene (blue) in SPAdes assembly of the susceptible isolate

Then we loaded the graph of the polymixin resistant isolate in Bandage first, and did the BLAST searches. The pmrB locus was intact, but the lpxC gene was interrupted. Very interrupted! No wonder ISMapper didn’t find this as it’s not an IS insertion at all, but rather the gene is interrupted by a large sequence, in an event that appears to involved the translocation of the entire genomic resistance island AbaR4 into the middle of the lpxC open reading frame.

Bandage screenshot

Interruption of lpxC associated with movement of the antibiotic resistance related genomic island, AbaR

The above image is created by doing BLAST searches (within Bandage) for the lpxC gene, AbaR4 gene and ISAba1 gene like this…

Bandage Screen Shot

BLAST search within an assembly graph using Bandage

…and then selecting ‘BLAST hits (solid)’ under the ‘Graph display’ settings on the left hand side of the Bandage viewer.

Screen Shot 2016-01-12 at 6.58.17 pm


Oh and just in case you think this is a weird one-off event that maybe you don’t need to worry about in your own genome data… check out the recent report from Scott Beaston and David Paterson in Queensland, who sequenced a nasty Klebsiella strain that was resistant to everything under the sun including carbapenems and colistin. They sequenced the genome with PacBio, and found the ISEcp1blaOXA-181 mobile element (which confers resistance to carbapenems) inserted into the mgrB regulatory gene in the chromosome, whose inactivation is responsible for colistin resistance. Oh and they also found another mobile element, ISEcp1blaCTX-M-15, inserted into the gene ompK35. Guess what inactivating this gene gives you? Cephalosporin resistance.


SEE ALSO: this post on using ISMapper and Bandage to track down multidrug resistance in Salmonella Typhi, the causative agent of typhoid

Locating drug resistance regions in short reads, using Bandage and ISMapper

In our recent paper on Salmonella Typhi, we described the multidrug resistant (MDR) clone H58 that is sweeping the world.

We’ve been monitoring this clone for almost 10 years (and the data suggests it actually emerged in the early 1990s), but the big change noted recently is the movement of the drug resistance locus out of the large conjugative (IncHI1) plasmid and into the chromosome.

I think this is critically important, because it means the large plasmid that carried the multidrug resistance genes into the cell can be lost, relieving the bacteria of the burden associated with replicating and expressing the plasmid genome, without losing multidrug resistance.

However, figuring out the location of the MDR locus is tricky, because it is flanked by copies of the IS1 transposase. This is what it looks like (the red genes on the ends are the IS1 copies).

Multidrug resistance locus in Salmonella Typhi

Multidrug resistance locus in Salmonella Typhi

Repeated sequences like these flanking IS1 sequences complicate assemblies… because there are multiple possible paths in and out of the repeated sequence, most assemblers will place the repeated sequence in its own contig, and the various paths in and out of it in separate contigs.

Here’s an example of an assembly graph showing the MDR locus above, visualised using Bandage, developed by Ryan Wick in my group… The green bit is a BLAST hit to the whole IS1 transposase, and you can see there are multiple alternative paths through the IS:

bandage IS1

And here is the same graph, but this time colouring in all the genes encoded within the MDR locus (BLAST hits to each open reading frame are shown in a different colour; the IS1 has 2 ORFs):

Screen Shot 2015-07-20 at 3.33.59 pm

So, inferring the location of the MDR locus from short read data is important but tricky. What do do?

Well, turns out it’s pretty easy to figure out what’s happening using Bandage! In this example, we can’t tell where the IS1 (and MDR locus) is inserted by looking at the assembled contigs. But by looking at this graph, we can see there are only two paths out of the IS1; one leads into the MDR locus (and back to the IS1), and the other leads to a single contig. By exporting that contig sequence from Bandage and blasting it in NCBI, it’s pretty trivial to discover that this is a piece of Typhi chromosome!

Here’s an example assembly graph from a different strain:
Screen Shot 2015-07-20 at 3.45.54 pmWhen I use Bandage to blast for the IncHI1 plasmid sequence (hits in blue) as well as the MDR locus genes, it’s pretty easy to see that the MDR locus is located in the plasmid:

Screen Shot 2015-07-20 at 3.47.05 pm

So basically – Bandage can be super useful for locating resistance genes (or any genes of interest really), in the presence of repeat sequences!

In the Typhi paper, we had hundreds of genomes to analyse so of course didn’t manually inspect each graph. Instead we used ISMapper (from my PhD student Jane Hawkey) to determine the IS1 insertion sites in each strain, and coupled this with what we knew about the presence of the plasmid and resistance genes in each strain (using SRST2, also from our group), to figure out which strains had the MDR locus and where:

MDR_summary_regionAsRing

Of course, all this is easy with long read sequencing… in the paper we used PacBio to confirm some the insertion sites in cyaA and yidA, and the guys at Public Health England independently found the yidA site using Nanopore.

But with the right tools, you can actually figure out a lot of these questions using Illumina data alone.

Population genomics of Klebsiella

Well, after almost 6 years, our Klebsiella pneumoniae genomics paper is finally out!

It’s a beast of a thing and there are still a million and one questions to address just from this one data set. For those interested in looking at the data for themselves, the raw reads are available under accession ERP000165, the assemblies are in Sylvain Brisse’s Klebsiella pneumoniae BIGSdb at the Pasteur Institute, and the tree + metadata are available for your interactive viewing pleasure in MicroReact.

The paper itself is open access in PNAS, you can read it here.

Genomic analysis of diversity, population structure, virulence, and antimicrobial resistance in Klebsiella pneumoniae, an urgent threat to public health

Screen Shot 2015-06-18 at 4.10.42 pm

Whole genome diversity in K. pneumoniae

There have been lots of really nice Klebs genomics papers out in the last 18 months or so, examining the evolution of the ST258 clone that carries the KPC gene (K. pneumoniae carbapaenemase) and is wreaking havoc in hospitals all over the place (including recently in Melbourne), and also several hospital-based studies tracking transmission and evolution of local drug-resistant outbreaks.

But that is just the tip of the K. pneumoniae iceberg.

Our paper asks a completely different set of questions, which you could basically sum up as “what the hell is Klebsiella pneumoniae anyway?”

To do this, we sequenced ~300 genomes of really diverse K. pneumoniae strains. We didn’t have much information about genetic diversity to go on, so we chose strains with different phenotypes (antimicrobial resistance patterns, capsular serotypes or sequence types where known), from different sources (human and animal, asymptomatic carriage and infections of various kinds), and from different geographical locations.

This was done by an international group of collaborators who pooled their resources, not only sharing their precious strain collections but also digging through hospital and other records to find as much information about the strains as possible.

You can view the tree and associated metadata, including geographical origin and source information, over on Microreact.Screen Shot 2015-06-18 at 4.09.33 pm

We found out some pretty interesting things about Klebsiella pneumoniae, including the fact that what’s identified as K. pneumoniae using standard tests is actually a mixed bag of three related species, that now have their own names: K. pneumoniae (KpI group, which includes the majority of clinical isolates and all the stuff you might have heard of like the clone that causes rhinoscleromatis, and the KPC clone ST258, and the hypervirulent clone ST23); K. quasipneumoniae; and K. variicola (plant associated and usually nitrogen-fixing).

By now, this species stuff has been nutted out (mainly by co-author Sylvain Brisse from Institut Pasteur) by analysing marker gene sequences, but it’s really important to be able to show that those patterns hold at the whole-genome level, and we found some interesting things about the distribution of the rarer species (see the paper for details).

Kp_pop_network

Importantly, we did the whole pan-genome analysis thing and found that as a population, K. pneumoniae has more genes than humans. Almost 30,000 in fact. Each individual strain has ~5,500 genes, but <2,000 of those are core genes that are common to all K. pneumoniae. The rest are accessory genes that can come and go, helping the bug to adapt to new environments.

Kp_pan_genome

One of the cool things we were able to do with our data set, which you just can’t do with genomic studies focused on specific clones or outbreaks, was to look at statistical associations between accessory genes and phenotypes. Admittedly our available phenotypes were pretty limited, but we found a few important things.

1. VIRULENCE

We screened for genes associated with virulence in humans by focusing in on invasive infections, and comparing gene frequencies in human isolates from invasive community-acquired infections (i.e. the kind of infections that land you in hospital) vs. those in human carriage isolates or hospital acquired infections (i.e. the kind of infections that get you when you are already in hospital for something else and are particularly vulnerable to infection).

The only genes that were significantly associated with invasive infection in humans were rmpA and rmpA2, which upregulate capsule production, and genes related to iron acquisition (specifically acquired siderophore systems that can help to steal iron from animal hosts – see paper for details). These genes have been known about for some time, based on mouse models and knowledge of other pathogens, however we were able to show that these genes are significantly associated with invasive K. pneumoniae disease in humans, which is not something that can be proven directly using experimental systems. (The siderophore story actually goes a bit deeper than the iron issue… it’s a bit too complex to go into here but I recommend reading Michael Bachman’s work e.g. “Interaction of lipocalin 2, transferrin, and siderophores determines the replicative niche of Klebsiella pneumoniae during pneumonia” in MBio, 2012).

siderophores_by_class

Interestingly, doing the same test in bovine isolates showed that the story is very different: we had a lot of isolates from dairy herds, including clinical and subclinical mastitis; asymptomatic carriage isolates and strains from the farm environment… and found that an acquired lactose operon was almost perfectly associated with mastitis in cows! Something similar has been observed before in Streptococcus agalactiae.

2. ANTIBIOTIC RESISTANCE

Resistance genes were associated with human hospital isolates and human carriage isolates. This is far from an ideal study design to test this, as we had different types of collections from different geographical regions; however, even when you look within different local collections you see the same patterns: (a) comparing bovine and human isolates from NY state, the resistance genes were all in human isolates not cow isolates; (b) comparing human carriage and infection isolates (both nosocomial and community acquired) in Vietnam, the resistance genes were mainly in human carriage and hospital isolates, not in community infections; (c) in the remaining countries, isolates from infections acquired in hospital had more resistance genes than those that were considered nosocomial (diagnosed within 48 hours of admission).

Screen Shot 2015-06-18 at 5.12.24 pm

What’s really interesting is that while resistance genes and virulence genes are both highly mobile components of the accessory genome, they were essentially orthogonal in their distribution. The resistance genes were mainly in hospital acquired infections and carriage isolates, whereas the virulence strains were mainly found in isolates from community acquired infections.

resistance-virulence-axis-2So far, this has resulted in the emergence of two very different kinds of K. pneumoniae clones of importance to human health: hypervirulent clones, and multidrug resistant clones. This is pretty lucky, as it means the hypervirulent clones are generally sensitive to antibiotics (although antimicrobial treatment is difficult for some conditions, like liver abscess), and the problem of untreatable highly drug resistant Klebs infections has not spread outside of hospitals.

Unfortunately, our luck appears to be runnning out and we are already starting to see the convergence of virulence and resistance. Hypervirulent ST23 strains, which have all four of the acquired siderophore systems, are accumulating antibiotic resistance genes. And about half of the KPC Klebs ST258 strains causing problems in hospitals globally have one of the siderophore gene clusters, yersiniabactin, which has been shown in clinical ST258 isolates to confer enhanced ability to cause pneumonia. How long till the other virulence genes creep in? We need to be watching!

Also, our data indicates that there are plenty of other hypervirulent or multidrug resistant Klebs clones emerging out there… convergence of virulence and resistance could happen in any one of them, so we need to be thinking and monitoring beyond the well-known ST23 and ST258 strains.

In any case, genomic surveillance is going to become really important for Klebsiella

A global picture of typhoid bacteria

New paper out: (a bit delayed due to travelling the world for science…)

Phylogeographical analysis of the dominant multidrug-resistant H58 clade of Salmonella Typhi identifies inter- and intracontinental transmission events

Nature Genetics 2015 Jun;47(6):632-9. doi: 10.1038/ng.3281

This paper provides a whole-genome snapshot of nearly 2000 genomes of the typhoid bacterium, Salmonella Typhi. The strains involved come from 63 countries contributed by dozens of people around the world, and were sequenced at the Sanger Institute with funding from the Wellcome Trust.

You can get the raw sequence reads under accession ERP001718, and play with the phylogenetic tree and associated map at the new MicroReact website:

Countries included in the study

Countries included in the study

I will post more later about plotting trees & metadata dynamically with MicroReact, and statically with Python and R.

But back to typhoid. This project is special for me for a number of reasons…

  • It is about Typhi, the bug that suckered me into directing my genomics skills into studying pathogens and infectious disease, and was the subject of my PhD project with Gordon Dougan and Julian Parkhill at the Sanger Institute, and Duncan Maskell at Cambridge.
  • It is a natural continuation of my PhD project, with the grunt work done by the new PhD student who took over typhoid genomics work in the Dougan lab when I moved back to Australia (Vanessa Wong, MD PhD), with me helping to direct the analysis from down here in Melbourne.
  • It is a great illustration of how sequencing has changed… The first Typhi genome sequence was done at the Sanger Institute using capillary sequencing, and was published in 2001 (Parkhill et al, Nature). In my PhD project (also at the Sanger Institute), I analysed 19 Typhi genomes sequenced with two sequencing platforms that were new and super-duper back in 2006: 454 (now dead) and Solexa (now known as Illumina – currently ruling the sequencing world globally). This was published in 2008, seven years after the first genome (Holt et al, Nature Genetics). Now, another 7 years later in 2015, we are publishing almost 2000 genomes.
  • Typhi is still one of the best examples I know of how sequencing has transformed bacterial surveillance and opened up a whole new field of genomic epidemiology. Before we could look at whole genomes, every Typhi strain looked pretty much the same genetically… there is so little variation, that lower resolution approaches like MLST just couldn’t tell us anything. Now that we can capture whole genomes relatively easily, we can track the transmission and evolution of these bugs essentially in real time.

So what did all this sequencing achieve? Basically we learnt a lot about a particularly tricky clone, called H58, that has spread quite rapidly across Asia and Africa and is responsible for most cases of multidrug resistant typhoid (infections that don’t respond to treatment with most antibiotics). About half of all our isolates belonged to this clone.

  • By comparing root-to-tip branch lengths in the phylogenetic tree of H58 to the isolation dates of each strain, we found evidence of a temporal signal. So we did BEAST analysis, using the isolation date of each strain to date the tips and model mutation rates and divergence dates for H58. This showed that SNPs accumulated slowly in the Typhi H58 genome, at a rate of ~2 SNPs every 3 years. This placed the emergence of H58 at ~1989, just before our oldest example of H58 (1992). We haven’t been able to do proper dating in Typhi before, probably because most of the samples we’ve looked at previously have been phylogenetically diverse strains that are separated by centuries of evolution including periods of epidemic transmission (higher mutation rate per unit time) and long-term carriage (lower mutation rate per unit time). Here we probably have enough data from a period of epidemic transmission of H58 that the signal from epidemic transmission is detectable. I think this is very similar to Mycobacterium tuberculosis (TB), which notoriously has very little temporal signal, and yet a localised 4-decade transmission chain in Argentina showed very strong temporal signal.pathogen_linear_regression_fullANDh58
  • The geographical distribution of the H58 isolates tell us a lot about the routes by which H58 has travelled the world. The tree of H58 is so big that it’s hard to see what’s happening…. so to make it easier, I used R to collapse localised subclades of H58 that contained isolates from a single country (panel A – the size of the circle reflects the number of isolates in the subclade), and showed the time span for each subclade next to the tree (panel B). Occasionally there were one or two isolates within a localised subclade that were sourced from neighbouring countries, indicating transfer to those countries… these are shown in panel C.

collapsed_tree_timelines2

  • We inferred these geographical patterns of the spread of H58, based on the tree and the regions of isolation:

map

  • We learnt a lot about the evolution of multidrug resistance in Typhi H58. We knew that resistance to all first-line antibiotics was usually encoded in one big transposon, which came into H58 in a IncHI1 plasmid. But the new collection showed that this transposon has transferred into the Typhi H58 chromosome, not once but many times! These transfers have happened in separate events, in different parts of the world, and into different parts of the chromosome. This is what the transposon looks like, and two of the insertion sites relative to the reference chromosome (CT18):

Acquired multidrug resistance in Typhi H58

  • Finding transposon insertion sites is tricky! The transposon has copies of the IS1 transposase at either end, which we think are responsible for moving the whole transposon around. This poses a problem for genome assembly with short reads. One way around this is to sequence with long reads… the figure above shows two different insertion sites that we confirmed by using PacBio sequencing to get complete genomes. But we had >850 H58 genomes sequenced using Illumina which gives us short reads, so really we needed to figure out the insertion sites as best we could using the Illumina data. Luckily my PhD student Jane Hawkey had been working on a method to do this, called ISMapper. Using this approach, we could identify all the IS1 insertion sites in every Illumina-sequenced genome. We also found a couple of additional plasmids. This is where all the different multidrug resistance determinants are in the H58 population:

MDR_summary_regionAsRing

Finally, a clear message from this study is that we need to do a lot more sequencing of Typhi! While we have a lot of genomes here, there are large geographic areas that we just don’t know much about. Plus, we have seen that antibiotic resistance is evolving and changing fast, and we will need to keep up with this using ongoing genomic surveillance.