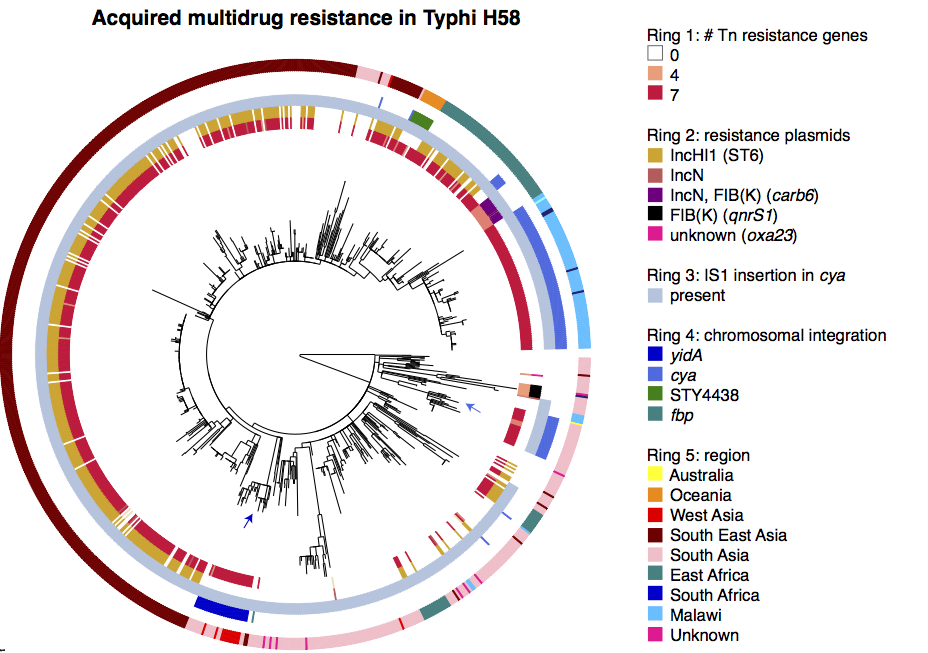
In our recent paper on Salmonella Typhi, we described the multidrug resistant (MDR) clone H58 that is sweeping the world.
We’ve been monitoring this clone for almost 10 years (and the data suggests it actually emerged in the early 1990s), but the big change noted recently is the movement of the drug resistance locus out of the large conjugative (IncHI1) plasmid and into the chromosome.
I think this is critically important, because it means the large plasmid that carried the multidrug resistance genes into the cell can be lost, relieving the bacteria of the burden associated with replicating and expressing the plasmid genome, without losing multidrug resistance.
However, figuring out the location of the MDR locus is tricky, because it is flanked by copies of the IS1 transposase. This is what it looks like (the red genes on the ends are the IS1 copies).
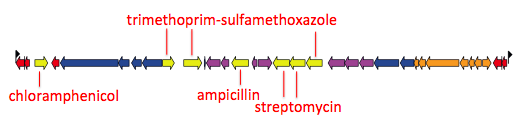
Multidrug resistance locus in Salmonella Typhi
Repeated sequences like these flanking IS1 sequences complicate assemblies… because there are multiple possible paths in and out of the repeated sequence, most assemblers will place the repeated sequence in its own contig, and the various paths in and out of it in separate contigs.
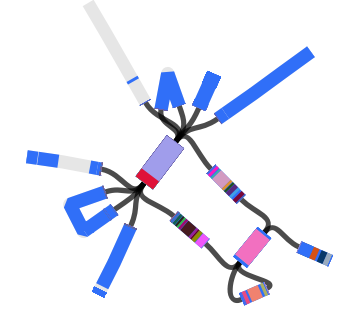
Here’s an example of an assembly graph showing the MDR locus above, visualised using Bandage, developed by Ryan Wick in my group… The green bit is a BLAST hit to the whole IS1 transposase, and you can see there are multiple alternative paths through the IS:

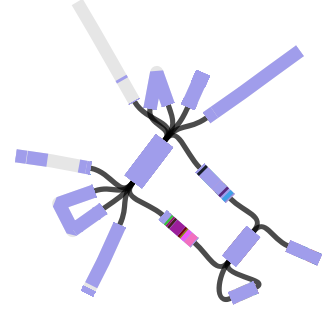
And here is the same graph, but this time colouring in all the genes encoded within the MDR locus (BLAST hits to each open reading frame are shown in a different colour; the IS1 has 2 ORFs):

So, inferring the location of the MDR locus from short read data is important but tricky. What do do?
Well, turns out it’s pretty easy to figure out what’s happening using Bandage! In this example, we can’t tell where the IS1 (and MDR locus) is inserted by looking at the assembled contigs. But by looking at this graph, we can see there are only two paths out of the IS1; one leads into the MDR locus (and back to the IS1), and the other leads to a single contig. By exporting that contig sequence from Bandage and blasting it in NCBI, it’s pretty trivial to discover that this is a piece of Typhi chromosome!
Here’s an example assembly graph from a different strain:
 When I use Bandage to blast for the IncHI1 plasmid sequence (hits in blue) as well as the MDR locus genes, it’s pretty easy to see that the MDR locus is located in the plasmid:
So basically – Bandage can be super useful for locating resistance genes (or any genes of interest really), in the presence of repeat sequences!
In the Typhi paper, we had hundreds of genomes to analyse so of course didn’t manually inspect each graph. Instead we used ISMapper (from my PhD student Jane Hawkey) to determine the IS1 insertion sites in each strain, and coupled this with what we knew about the presence of the plasmid and resistance genes in each strain (using SRST2, also from our group), to figure out which strains had the MDR locus and where:
Of course, all this is easy with long read sequencing… in the paper we used PacBio to confirm some the insertion sites in cyaA and yidA, and the guys at Public Health England independently found the yidA site using Nanopore.
But with the right tools, you can actually figure out a lot of these questions using Illumina data alone.

2 comments