Author: kat

Bacterial genomics researcher in Melbourne, Australia

Behind the paper: SRST2 for short read sequence typing of bacterial pathogens

[Originally posted by Kat on her BacPathGenomics blog, Nov 2014]

I’m pleased to say our paper SRST2: Rapid genomic surveillance for public health and hospital microbiology labs is now out in the Genome Medicine/Genome Biology special issue Genomics of Infectious Diseases!

Having posted the code to GitHub over a year ago, and the paper to BioRxiv in June, it is great to have it finally published. I must say I love the BioRxiv experience, it is great to know the paper was viewed >1500 times while it was stuck in the peer review/publication process.

This project has been a fun journey, which started when I was lucky enough to get a fantastic summer intern, Harriet Dashnow (follow: @hdashnow), funded by VSLCI (our wonderful local supercompute cluster). Harriet’s job was to figure out how to apply our SRST code, which was designed to extract MLST information from Illumina reads (see code and BMC Genomics paper), to detect and type resistance genes and alleles. She did a fantastic job, but in doing so we realised that we needed to overhaul the scoring system to something that was faster and more robust. So, Mike Inouye designed a new scoring approach from the ground up, which Harriet and Bernie Pope from VLSCI turned into the new Python code that is SRST2. We then did a whole lot of testing on public data (mainly by Lesley Raven and Mark Schultz from the Holt & Inouye labs, with some guidance from Justin Zobel in the Computing & Info Systems department) and had our friends at the local reference lab, the Microbiological Diagnostic Unit (mainly Takehiro Tomita), test it out for themselves on a load of Listeria monocytogenes they had recently sequenced on their MiSeq.

What we came up with was some code that draws on the fundamental tools of the genomics trade (bowtie2, samtools & python) to rapidly and reliably detect genes and alleles direct from short read data. SRST2 has two modes, (i) MLST, where you can provide MLST alleles and profile definitions, and it will report sequence types; and (ii) gene detection and allele calling, suitable for screening for acquired genes such as resistance genes, virulence genes and/or plasmid genes.

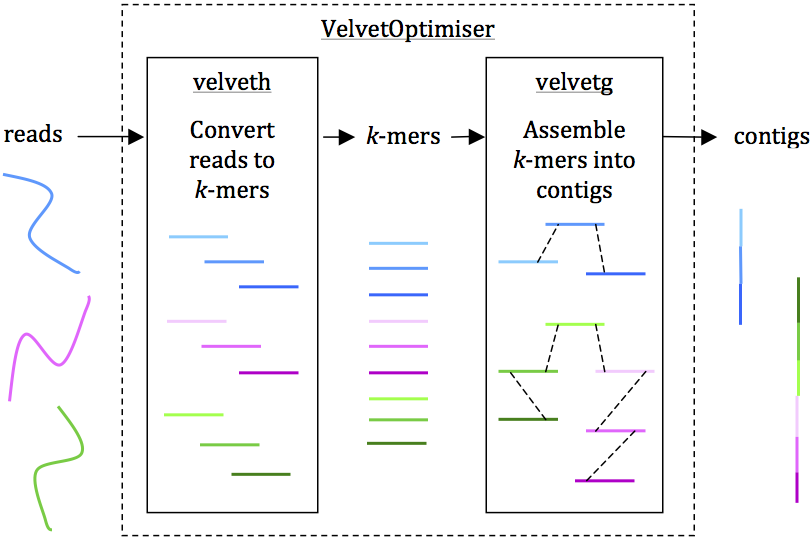
Figure 1 from the paper outlines how SRST2 works:

The coolest thing about SRST2 is that it is consistent and reliable, even at low read depths, which is absolutely critical for use in a routine diagnostic/surveillance workflow. The robustness of SRST2 stems from the fact that we use a mapping approach coupled with a pretty clever approach to scoring potential matches.

The alternative is to generate de novo assemblies, and then interrogate them with BLAST or other tools… the problem with that approach is that, while de novo assemblers like Velvet and SPAdes can do a great a job of assembling bacterial genomes, there is no way to guarantee you will get a good assembly with every read set. Anyone who works with biggish bacterial data sets of 100s-1000s of genomes knows – it is very hard to standardize the assembly process and establish a protocol that works consistently and reliably every time. And if you are needing to type loads of strains as part of routine service or investigations, you need to know you will get a reliable result every time. Figure 3 in the paper compares the overall performance (call rate x accuracy) of SRST2 vs BLAST analysis of highly optimised assemblies:

As you can see, once you get up to 15-20x read depth, SRST2 will consistently give you an answer, and that answer will be accurate. Whereas using assemblies – even highly optimised ones – you will always miss out on 1-5% of the answers.

We were also asked by a reviewer to compare SRST2 with the only other publicly-available program designed for MLST typing from short reads: the MLST Typer web service at the Danish Center for Genomic Epidemiology. Because this requires uploading read sets to the other side of the world, we only did this for one of our test data sets, 44 Salmonella genomes. The results are in Table 5, and showed that the website got the correct ST for only 14/44 genomes. SRST2 got correct STs for 43/44 genomes (for the 44th strain, SRST2 returned 6/7 alleles correctly and suggested that there is actually a SNP in the 7th allele, which could actually be correct but we cannot verify; MLST Typer did not call anything for this strain).

When it comes to detecting the presence of genes, such as acquired antibiotic resistance genes, SRST2 also outperformed assembly based approaches. We got accurate detection at depths >3x, and picked up many resistance genes that did not assemble well, especially at depths below 15x (see Fig 5 of the paper). Again, we compared to ResFinder on the Center for Genomic Epidemiology website, and found SRST2 performs much better (see Table 3 in the paper). I don’t want to criticize the tools on the Center for Genomic Epidemiology website, as they are really useful for people who have limited resources to analyse genome data… but I do think people need to be aware that the successful use of those tools rely heavily on first obtaining a high quality assembly, and you can very easily miss important antibiotic resistance genes.

So what are the main uses for SRST2?

The key jobs SRST2 is good for are:

  • detecting the presence of genes
  • identifying specific alleles for those genes from a known set of sequencescalculating sequence types (STs) specified by MLST-style schemas.

So it is great for detecting acquired genes, such as antibiotic resistance genes, virulence genes or plasmid genes; or extracting MLST information. To this end, the SRST2 download includes:

  • a script to help you pull down the latest MLST data from pubmlst.org for >100 MLST schemes
  • instructions and code for typing virulence genes from the Virulence Factor Database (VFDB)
  • SRST2-compatible versions of popular resistance gene databases (ARG-Annot, ResFinder) and the PlasmidFinder database of plasmid replicons

For example, in the paper we show the use of SRST2 for investigating changing patterns of vancomycin resistance amongst Enterococcus faecium isolated at a local hospital (data from this 2013 MBio paper). We analysed the Illumina readsets using SRST2 to detect resistance genes and perform MLST. SRST2 returned a table of strains with columns to indicate sequence types, alleles for each locus in the MLST scheme, and the presence of acquired resistance genes (shown here viewed in Excel):

srst2_data_excel_Enterococcus

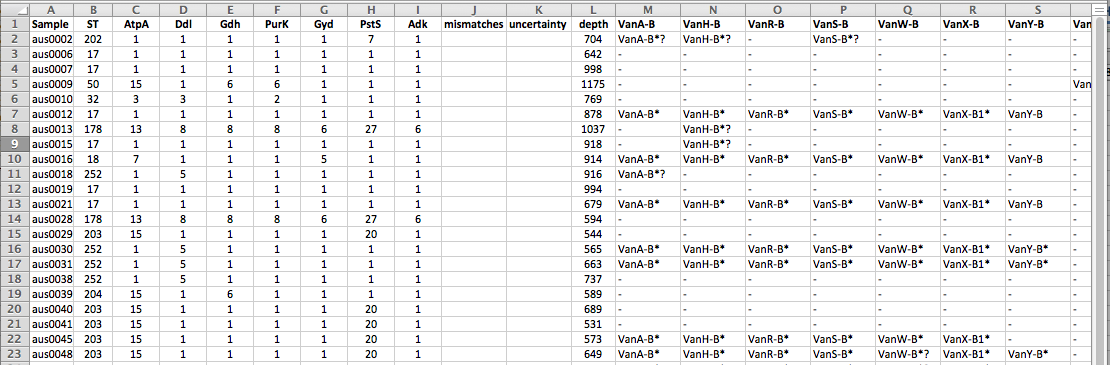
You will notice that the depth values are VERY high for this data set, as the sequencing was done at relatively low-plex on a HiSeq. This means that it takes a long time to map (and VERY long time to assemble) these read sets… however note that you can obtain the same results much faster by telling SRST2 to use just the first 1 or 2 million reads per strain, which is more than enough to get accurate results (–stop_after 1000000).

We used R to summarize and plot the results, which are shown in Figure 7 in the paper (R code is in the /scripts directory in the SRST2 download):

Panel (a) shows that vanB vancomycin resistance became more frequent over the 12 years investigated, while panel (b) shows that the STs also changed during this time period… so is the increase in resistance linked to the introduction of new van-resistant ST252 and ST203 strains?

Panel (c) puts the ST & resistance results together… the tree on the left is a dendrogram depicting the similarity between sequence types based on number of shared alleles; MLST profiles (STs and their component alleles) are shown next to this. On the right, the frequency of each ST is shown as a bar graph, which highlights that there are 3 main types, ST17, ST252 and ST203, which all share 5-6 alleles. The heatmap in the middle shows the frequency of the various resistance genes within each ST – it is clear that the vanB locus is present in all 3 STS, but only at ~50% in each… so the increase in vancomycin resistance is not explained by the introduction of resistant ST252 and ST203 clones; rather, vancomycin resistance comes and goes, via movement of the vanB operon, in all 3 common STs.

The whole genome phylogenetic analysis in the 2013 MBio paper shows this in much finer detail of course; but the basic conclusions could be drawn from a very rapid analysis with SRST2.

The same is true for hospital outbreak investigations (see examples in the paper) – in a few minutes SRST2 can show whether a potential transmission case has the same ST and acquired genes profile as confirmed outbreak cases; if the ST matches, genome-wide SNP trees can be used to investigate further.

My next post will have some pro tips for using SRST2.

Bacterial genomics tutorial

UPDATE: Version 2 of the tutorial (posted July 2017) is available here.

[Originally posted by Kat on her BacPathGenomics blog, April 2013]

This is a shameless plug for an article and accompanying tutorial I’ve just published together with David Edwards, my excellent MSc Bioinformatics student from the University of Melbourne. The accompanying tutorial is available here.

The idea for this came from discussions at last year’s ASM (Australian Society of Microbiology) meeting, where it was highlighted that there was a lack of courses and tutorials available for biologists to learn the basics of genomic analysis so that they can make use of next gen sequencing. Michael Wise, a founding editor of BMC Microbial Informatics and Experimentation based at UWA in Perth, suggested the new journal would be an ideal home for such a tutorial… so here we are:

Beginner’s guide to comparative bacterial genome analysis using next-generation sequence data

http://www.microbialinformaticsj.com/content/3/1/2/

High throughput sequencing is now fast and cheap enough to be considered part of the toolbox for investigating bacteria, and there are thousands of bacterial genome sequences available for comparison in the public domain. Bacterial genome analysis is increasingly being performed by diverse groups in research, clinical and public health labs alike, who are interested in a wide array of topics related to bacterial genetics and evolution. Examples include outbreak analysis and the study of pathogenicity and antimicrobial resistance. In this beginner’s guide, we aim to provide an entry point for individuals with a biology background who want to perform their own bioinformatics analysis of bacterial genome data, to enable them to answer their own research questions. We assume readers will be familiar with genetics and the basic nature of sequence data, but do not assume any computer programming skills. The main topics covered are assembly, ordering of contigs, annotation, genome comparison and extracting common typing information. Each section includes worked examples using publicly available E. coli data and free software tools, all which can be performed on a desktop computer.

Four great tools

In the paper and tutorial, we introduce the four tools which we rely on most for basic analysis of bacterial genome assemblies: Velvet, ACT, Mauve and BRIG. All except ACT were developed as part of a PhD project, and have endured well beyond the original PhD to become well-known bioinformatics tools. New students take note!

In the paper, each tool is highlighted in its own figure, which includes some basic instructions. This is reproduced below, but is covered in much more detail in the tutorial that comes with the paper (link at the bottom).

1. Velvet for genome assembly

Possibly the most popular and widely used short read assembler, developed by the amazing Dan Zerbino during his PhD at EBI in Cambridge. Quite a PhD project!

Download | Paper | Protocol ]

Figure1_Velvet 

Reads are assembled into contigs using Velvet and VelvetOptimiser in two steps, (1) velveth converts reads to k-mers using a hash table, and (2) velvetg assembles overlapping k-mers into contigs via a de Bruijn graph. VelvetOptimiser can be used to automate the optimisation of parameters for velveth and velvetg and generate an optimal assembly. To generate an assembly of E. coli O104:H4 using the command-line tool Velvet:

• Download Velvet [23] (we used version 1.2.08 on Mac OS X, compiled with a maximum k-mer length of 101 bp)

• Download the paired-end Illumina reads for E. coli O104:H4 strain TY-2482 (ENA accession SRR292770)

• Convert the reads to k-mers using this command:

velveth out_data_35 35 -fastq.gz -shortPaired -separate SRR292770_1.fastq.gz SRR292770_2.fastq.gz

• Then, assemble overlapping k-mers into contigs using this command:

velvetg out_data_35 -clean yes -exp_cov 21 -cov_cutoff 2.81 -min_contig_lgth 200

This will produce a set of contigs in multifasta format for further analysis. See Additional file 1: Tutorial for further details, including help with downloading reads and using VelvetOptimiser.

2. ACT for pairwise genome comparison

Part of the Sanger Institute’s Artemis suite of tools. Also look at Artemis (single genome viewer), DNA Plotter (which can draw circular diagrams of your genomes) and BAMView (which can display mapped reads overlaid on a reference genome), they are all available here.

Download | Paper | Manual ]

Figure2_ACT

Artemis and ACT are free, interactive genome browsers (we used ACT 11.0.0 on Mac OS X).

• Open the assembled E. coli O104:H4 contigs in Artemis and write out a single, concatenated sequence using File -> Write -> All Bases -> FASTA Format.

• Generate a comparison file between the concatenated contigs and 2 alternative reference genomes using the website WebACT.

• Launch ACT and load in the reference sequences, contigs and comparison files, to get a 3-way comparison like the one shown here.

Here, the E. coli O104:H4 contigs are in the middle row, the enteroaggregative E. coli strain Ec55989 is on top and the enterohaemorrhagic E. coli strain EDL933 is below. Details of the comparison can be viewed by zooming in, to the level of genes or DNA bases.

3. Mauve for contig ordering and multiple genome comparison

Developed by the wonderful Aaron Darling during his PhD, he is now Associate Professor at University of Technology Sydney. Also see Mauve Assembly Metrics, an optional plugin for assessing assembly quality which was developed for the Assemblathon.

Download | Paper | User Guide ]

Fig3_Mauve

Mauve is a free alignment tool with an interactive browser for visualising results (we used Mauve 2.3.1 on Mac OS X).

• Launch Mauve and select File -> Align with progressiveMauve

• Click ‘Add Sequence…’ to add your genome assembly (e.g. annotated E. coli O104:H4 contigs) and other reference genomes for comparison.

• Specify a file for output, then click ‘Align…’

• When the alignment is finished, a visualization of the genome blocks and their homology will be displayed, as shown here. E. coli O104:H4 is on the top, red lines indicate contig boundaries within the assembly. Sequences outside coloured blocks do not have homologs in the other genomes.

4. BRIG (BLAST Ring Image Generator) for multiple genome comparison

From Nabil-Fareed Alikhan at the University of Queensland, also as part of a graduate project, which I believe is still in progress…

Download | Download BLAST | Paper | Tutorial ]

Fig4_BRIG

BRIG is a free tool that requires a local installation of BLAST (we used BRIG 0.95 on Mac OS X). The output is a static image.

• Launch BRIG and set the reference sequence (EHEC EDL933 chromosome) and the location of other E. coli sequences for comparison. If you include reference sequences for the Stx2 phage and LEE pathogenicity island, it will be easy to see where these sequences are located.

• Click ‘Next’ and specify the sequence data and colour for each ring to be displayed in comparison to the reference.

• Click ‘Next’ and specify a title for the centre of the image and an output file, then click ‘Submit’ to run BRIG.

• BRIG will create an output file containing a circular image like the one shown here. It is easy to see that the Stx2 phage is present in the EHEC chromosomes (purple) and the outbreak genome (black), but not the EAEC or EPEC chromosomes.

Tutorial

The tutorial accompanying the article is available here. To give you an idea of what’s covered, here is the table of contents:

1. Genome assembly and annotation…………………………………………………………… 2

1.1 Downloading E. coli sequences for assembly…………………………………………….. 2

1.2 Examining quality of reads (FastQC)………………………………………………………… 2

1.3 Velvet – assembling reads into contigs………………………………………………………. 4

1.3.1 Using VelvetOptimiser to optimise de novo assembly with Velvet………….. 6

1.4 Ordering contigs against a reference using Mauve………………………………………. 7

1.4.1 Viewing the ordered contigs (Mauve)………………………………………………… 10

1.4.2 Viewing the ordered contigs (ACT)……………………………………………………. 13

1.5 Mauve Assembly Metrics – Statistical View of the Contigs………………………… 15

1.6 Annotation with RAST……………………………………………………………………………. 15

1.6.1 Alternatives to RAST………………………………………………………………………. 19

2. Comparative genome analysis……………………………………………………………….. 20

2.1 Downloading E. coli genome sequences for comparative analysis………………. 20

2.2 Mauve – for multiple genome alignment……………………………………………………. 21

2.3 ACT – for detailed pairwise genome comparisons……………………………………… 24

2.3.1 Generating comparison files for ACT…………………………………………………. 24

2.3.2 Viewing genome comparisons in ACT……………………………………………….. 27

2.4 BRIG – Visualizing reference-based comparisons of multiple sequences……… 29

3. Typing and specialist tools……………………………………………………………………. 34

3.1 PHAST – for identification of phage sequences…………………………………………. 34

3.2 ResFinder – for identification of resistance gene sequences………………………… 34

3.3 Multilocus sequence typing…………………………………………………………………….. 34

3.4 PATRIC – online genome comparison tool………………………………………………… 34

Clarifier: Bacterial populations and communities

[This was originally posted by Kat on her BacPathGenomics blog, April 2011]

Two areas where next-gen sequencing is making a big impact in the bacterial world are the analysis of ‘bacterial populations’ and ‘bacterial communities’. While these might sound similar, they are actually very different.

In common parlance we sometimes use ‘population’ and ‘community’ somewhat interchangeably in talking about groups of humans. We might say that in Melbourne, coffee drinking is common in the local population, or that it is common in the local community. What we mean is that it’s common among people living in Melbourne.

In biology, the term ‘population’ has a specific meaning – a group of individuals of the same species (i.e. able to interbreed; but note this concept is complex in bacteria), defined by time and space. So we can talk about the currrent human population of the Earth, or the human population of Melbourne 20 years ago. Note that this is intimately tied up with the concept of species, as separation into two distinct populations is a key step towards diverging into different species. On the other hand, ‘community’ refers more generally to the group of organisms inhabiting a particular ecological niche, which could include any number of species. So for example we could talk about the population of karri trees (a species of eucalyptus found in the south west of Western Australia), or the community of plants inhabiting the karri forrest.

Bacterial populations

When we talk about bacterial populations, what we mean is investigating the population structure of a particular bacterial species/subtype… in theory this aims to understand the population in its entirety, but in practice usually involves studying lots of individual members of the population and making inferences about the population as a whole. We can attempt to understand populations at different levels of localisation…. e.g. we can study a highly localised population, like the population of Salmonella Typhi inhabiting the gall bladder of a typhoid carrier; or more expansive populations of Salmonella Typhi circulating in a city, a country or around the globe.

Sequencing has been a great tool for understanding bacterial populations, by allowing lots of individual members of a population (i.e. individual bacterial isolates or colonies) to be compared at the sequence level. Sequence data is ideal for this, as the differences between individuals are often tiny  (i.e. there is very little variation) since they belong to a single population, and DNA sequence data allows us to detect single nucleotide changes (ie provides high resolution). Also, since we have well-developed models of sequence evolution (ie how nucleotide changes accumulate), sequence data can be interpreted using phylogenetic analysis. This really kicked off a decade ago with multi-locus sequence typing (MLST; see wikipedia entry(!) or Maiden et al, 1998 for more info) and is now expanding rapidly with the advent of sequencing platforms that allow whole genomes of hundreds of isolates to be sequenced (e.g. 96 bacterial isolates can be readily sequenced in a single run of the Illumina HiSeq, using multiplexing).

This kind of analysis can be used in public health microbiology and infectious disease epidemiology to trace outbreaks or transmission (sometimes called molecular epidemiology or genomic epidemiology). It can also be used to study the evolution of drug resistance or pathogenesis/virulence in bacterial populations (microevolution, since it is occurring within populations), or the impact of a novel vaccine or drug on a given bacterial population, all of which can be useful for designing and monitoring public health interventions or making treatment recommendations.

A great recent example is the study by Nick Croucher (an immensely talented PhD student) from the Sanger Institute, and numerous collaborators, who compared the genomes of 240 Streptococcus pneumoniae isolates of the PMEN1 subtype, collected from all over the world since 1984. By comparing the genomes of these isolates, they found evidence of frequent homologous recombination with other S. pneumoniae, including exchange of genes encoding the capsule targeted by vaccination and acquisition of drug resistance genes. Assuming the sequenced isolates are reasonably representative of the global population of S. pneumoniae PMEN1, this indicates that the PMEN1 population is not isolated from the rest of the S. pneumoniae population but that there is constant gene exchange within and between S. pneumoniae groups, allowing the bacteria to escape the effects of human interventions including vaccine-induced immunity and exposure to antimicrobial drugs. We already ‘knew’ this could happen in bacterial pathogen populations, but this study provides direct evidence of it occurring in response to a specific vaccine and specific drugs used for treatment. See pubmed entry, unfortunately you need access to Science magazine to read the article.

Bacterial communities

On the other hand, when we talk about bacterial communities, what we mean is investigating the communities of bacteria present in a given sample. This is akin to walking through the forest and taking note of each plant you see, and the analysis methods borrow heavily from ecology. Studies of bacterial communities are being done in just about every kind of sample in which you would expect to find bacteria – from environmental samples (e.g. underwater caves; windscreen splatter) to human body sites (faeces or the gut; skin; nasal passages; read more at the Human Microbiome Project site).

The analysis usually focuses on determining which bacterial taxa (e.g. a genus, species or subgroup) were present in each sample, and their relative abundance. These can be compared across samples to identify taxa that are only present in certain kinds of environments, or whose presence is associated with another property of the sample (e.g. presence in the nose may be associated with development of otitis media). Communities can be examined more holistically to identify broad differences in the bacterial community structures associated with different samples.

Sequencing has dramatically improved the ease with which bacterial communities can be studied, via sequencing of DNA extracted from a given sample (e.g. a soil sample; a fecal sample). Two approaches are possible – sequence the raw DNA extract or amplify a conserved bacterial gene (using PCR) and sequence that. The first is true ‘metagenomics’, as you are sequencing all of the genomes present in the original sample, but this takes a lot sequencing effort and you may not need or want to know every single gene present in the sample. At the moment, Illumina platforms are most appropriate for this application as they have the highest throughput, however their short read lengths make assembly and analysis difficult. The second way, which usually targets the conserved 16S ribosomal RNA gene (‘16S sequencing’), is a more tractable way of determining what species/subgroups of bacteria are present in the sample and estimating their relative abundance. Multiplexing can be achieved by incorporating sample-specific barcodes into the amplicons during PCR, allowing hundreds of samples to be analysed in a single sequencing run.